РУССКИЙ ВОЕННЫЙ КОРАБЛЬ, ИДИ НА ХУЙМИ ПРАЦЮЄМО ДЛЯ УКРАЇНИ

Khmelnitsky, Zarichanska Street, 3/1,
floor 2, office 207

How we brought the “Rushnychok” brand 1.79 million UAH from Google Ads with a budget of only 41,000 UAH

How we brought the “Rushnychok” brand 1.79 million UAH from Google Ads with a budget of only 41,000 UAH

Information about the client

"Rushnychok" is an online home textile store with a wide selection: blankets, sheets, various types of towels, tablecloths, and much more. The store primarily works with wholesale customers.

CLIENT REQUEST

Our collaboration with "Rushnychok" began in the summer of 2024. Throughout the period up until 2026, we actively worked to improve the website's advertising. The goal we set together with the client was to consistently generate at least UAH 600,000 in monthly sales through advertising. This equates to approximately UAH 150,000 weekly. Below is how we achieved this and the results we achieved.

Вводные данные Input data

Market:

Ukraine

Niche:

Wholesale of home textiles

Какие проводились работы Progress of work

The campaigns were already live — now the daily routine began. Google Ads isn’t a “set it and forget it” button. It’s an ongoing process: you analyze data, figure out what works, cut out what’s draining the budget into nowhere, and scale up what drives results.

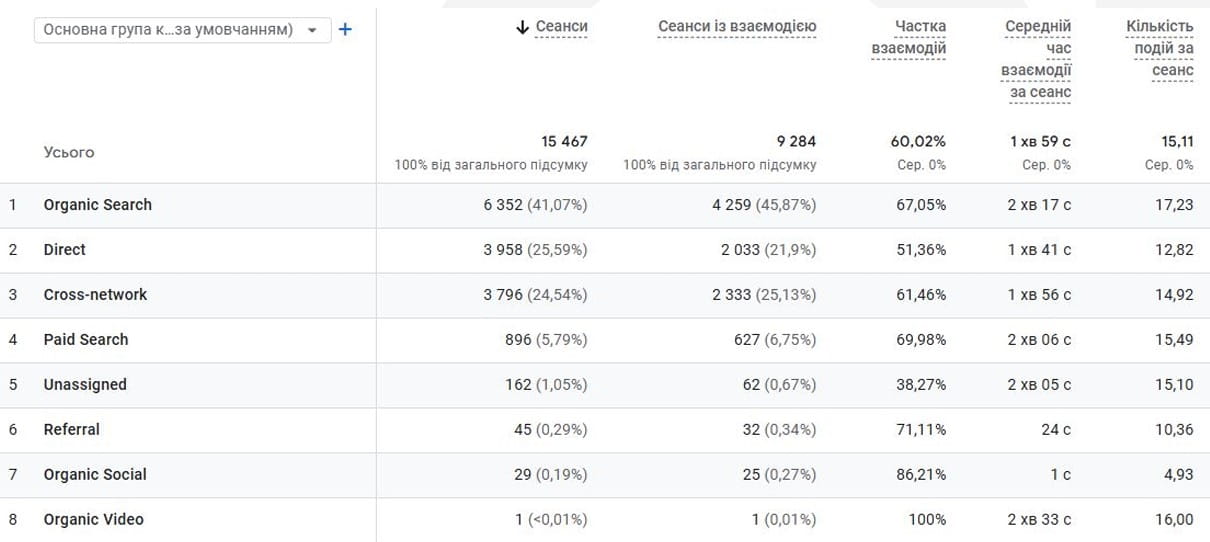
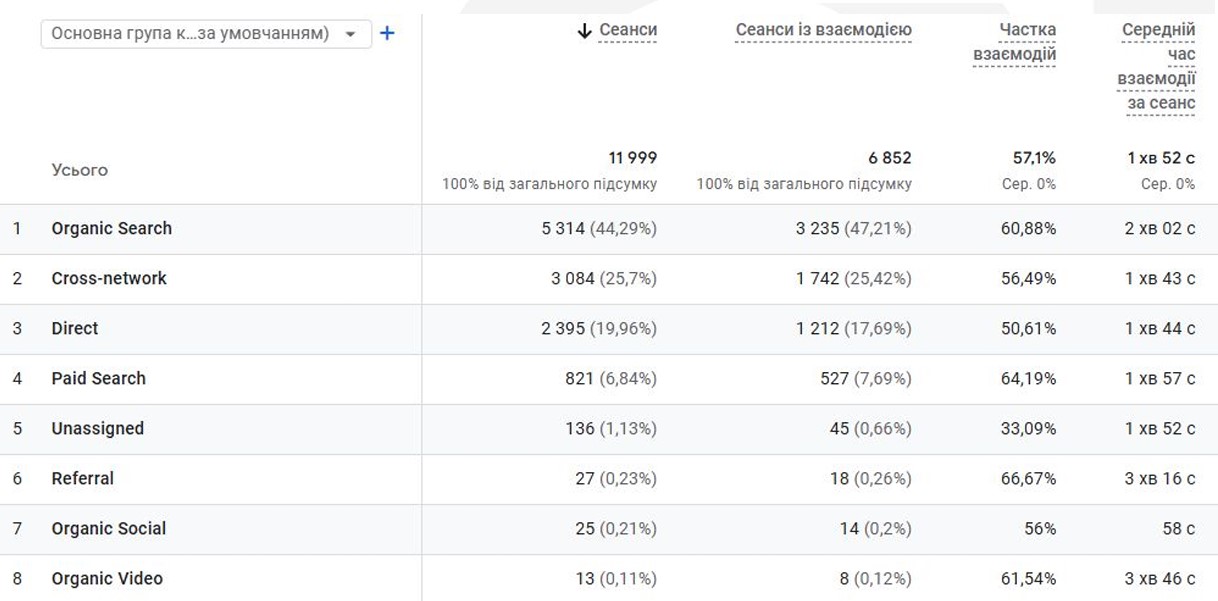
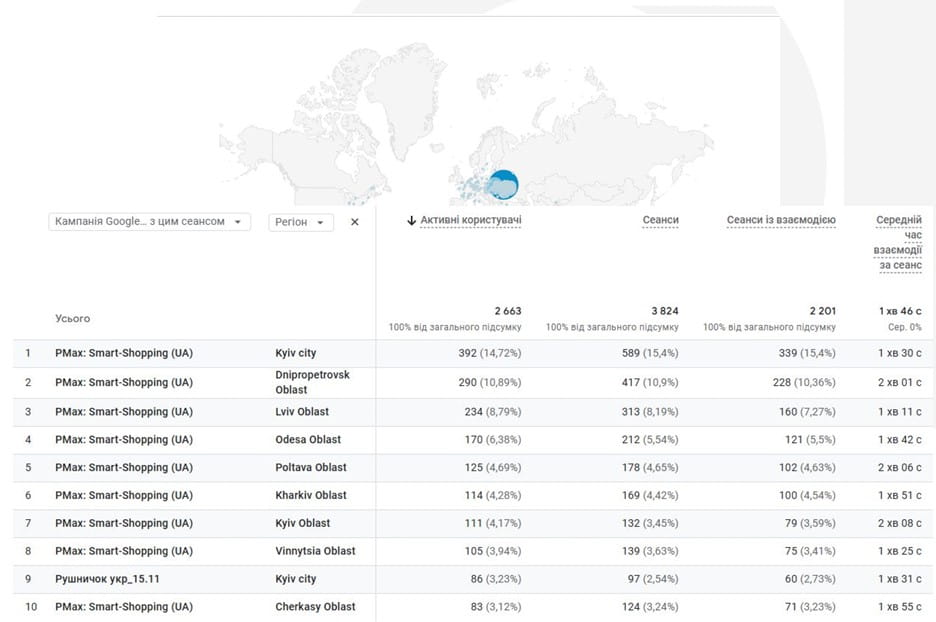
Monitoring user behavior on the website

Every user coming from an ad left a digital footprint: how much time they spent on the site, which pages they viewed, and whether they made it to the checkout page. The average time on site was around two minutes. That might not sound like much, but for an online store, it’s a great sign: a person didn’t just open and close the page, they were actually looking at the product.

Another interesting point: a buyer often visits the site multiple times before making a purchase. This is especially true for wholesale clients — they need to calculate, coordinate, and decide. That’s why we didn’t draw conclusions about ad effectiveness based solely on the first visit.

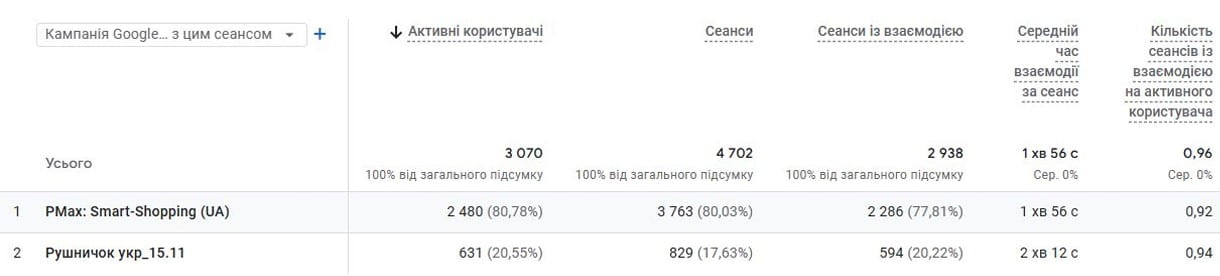
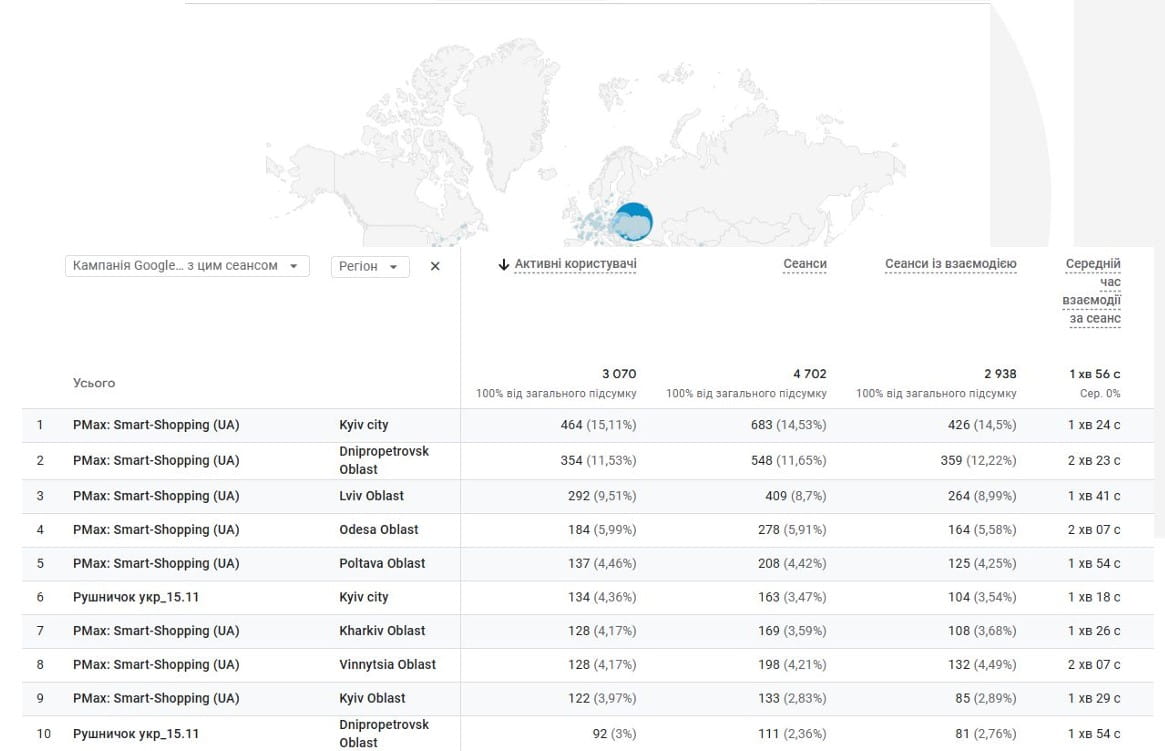
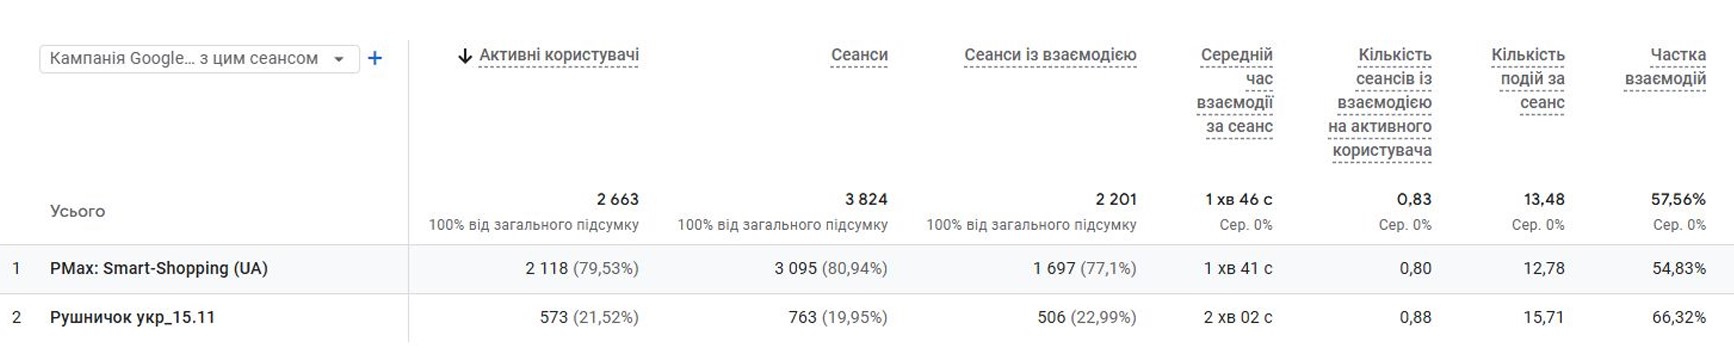
Continuously optimizing campaigns

Every week, we reviewed which keywords were actually bringing in buyers and which ones were just wasting money. Ads that didn’t deliver results were replaced. The budget was reallocated to where the returns were. It’s routine but critical work — without it, advertising quickly starts to “eat up” cash for nothing.

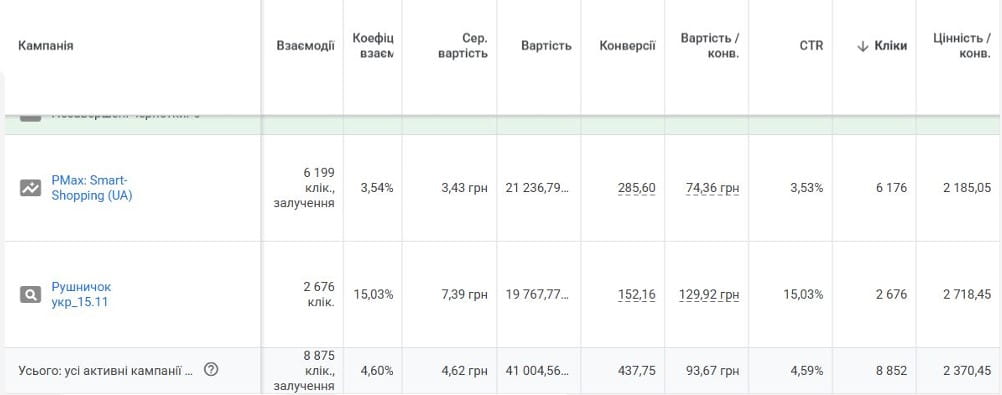
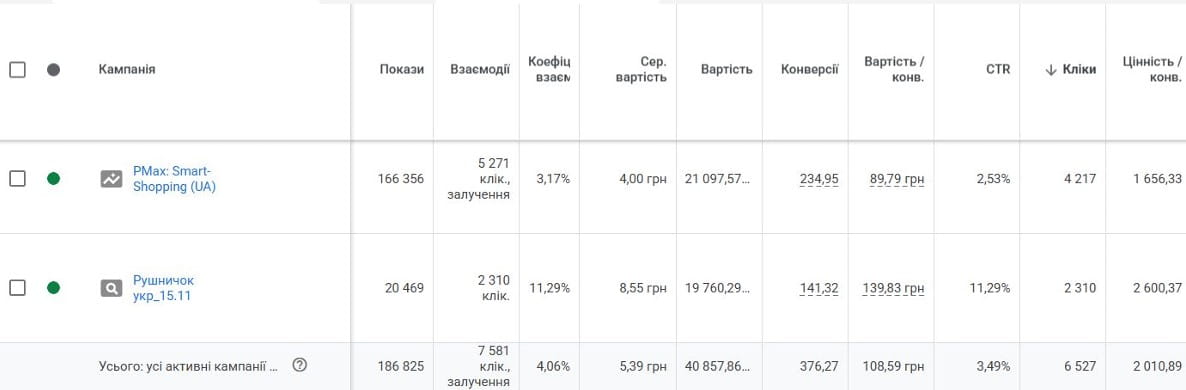
Tracking every sale driven by ads

We set up tracking so that every purchase on the website was tied to a specific ad campaign. This allowed us to clearly see: this particular campaign generated this many orders for this specific amount. No guesswork — just facts. It was based on this data that decisions for further strategy were made.

Полученный результат Obtained result

Over the last two months of work, we can speak of a sustainable result — not a one-time spike, but a systematic approach that delivers a predictable stream of orders. Let’s break down each month individually.

Month One

In March, the website received over 15,000 visits. Google Ads brought in 2,480 unique visitors — mostly new people who had never heard of the store before. They placed 438 orders totaling UAH 1,037,674. The average order value was UAH 2,369.

The target was UAH 600,000 — we achieved nearly double that amount. Meanwhile, ad spend remained within UAH 41,000, and the cost per acquisition (CPA) was lower than the previous month — UAH 93 compared to UAH 115 before. The optimization paid off.

March results 1

Traffic sources — all channels for the first month (Google Analytics)

March results 2

Active Google ad campaigns and their traffic share — month one.

March results 3

Ad campaign performance: spend, clicks, conversions — month one.

Where the buyers came from — TOP 5 regions:

Region Users
Kyiv 598
Dnipropetrovsk Oblast 446
Lviv Oblast 292
Odesa Oblast 184
Kharkiv Oblast 128
March results 4

Paid traffic geography by Ukrainian regions — month one.

Kyiv was the expected leader, but it’s notable that Dnipro, Lviv, and Odesa also generated substantial volume. The ads reached the entire country, not just the capital.

Month Two

In April, overall website traffic was slightly lower — around 12,000 visits. But let’s look at the key metric: the number of ad-driven orders remained exactly the same — 438. The advertising brought in the same amount of customers with a slightly lower budget (UAH 40,857).

Total revenue reached UAH 756,646 — lower than the previous month, but the UAH 600,000 target was again met with room to spare. The drop in total revenue is due to the fact that more people placed smaller orders this month. This wasn’t an issue with the ads — it was simply a different demand structure.


April results 1

Traffic sources — all channels for the second month (Google Analytics)

April results 2

Active Google ad campaigns and their traffic share — month two

April results 3

Ad campaign performance: spend, clicks, conversions — month two

Where the buyers came from — TOP 5 regions:

Region Users
Kyiv 478
Dnipropetrovsk Oblast 290
Lviv Oblast 234
Odesa Oblast 170
Poltava Oblast 125
April results 4

Paid traffic geography by Ukrainian regions — month two

The geography shifted slightly — Poltava Oblast replaced Kharkiv Oblast in the top list. Kyiv, Dnipro, and Lviv consistently remain the most active regions.

In two months, “Rushnychok” generated over UAH 1,794,000 in sales from Google Ads, against a target of UAH 600,000 per month. The budget remained stable (~UAH 41,000), and the number of monthly orders was identical. This isn’t luck; it’s a systematic process.

For this store, Google Ads is an investment with a predictable return, not an expense: we invested UAH 41,000 and gained over a million in sales. The next step is scaling: allocating more budget to the high-performing regions and focusing efforts on attracting wholesale clients with larger average order values.

Need high-quality pay-per-click advertising? Contact us!

Need Google advertising? Don't waste time searching, submit a request, and we'll get it done!